
Over the years, technology has become inextricably intertwined with learning delivery. From the advent of the CD-ROM through the dawning of the Internet and now onward through mobile devices, social media, and more, the ways we deliver learning rely increasingly more on technology, despite the fact that we still deliver so much in-person classroom training.
For many companies, using this technology is only possible via a learning management system (LMS). According to Brandon Hall Group’s 2015 Learning Technology Trends survey, 85 percent of companies use an LMS of some sort. As learning requires more technology and more complexity, an LMS becomes the only way to effectively manage it. This is why among large companies with more than 10,000 employees, 97 percent use an LMS, compared to 61 percent among small companies (less than 1,000 employees).
The penetration of LMS use across all companies has remained steady since 2012, with no significant increase or decrease. However, our study finds that things are in flux. Our key findings show that the way the LMS is implemented is changing; companies are not particularly satisfied with their systems; and a significant number of organizations are looking to switch systems. Here are the Top 5 findings from Brandon Hall Group’s 2015 LMS Trends Study, which involved approximately 300 respondents from 30 countries and 29 industries.
1. The Move to the Cloud Continues…Slowly
With seemingly great reluctance, the LMS market continues its march to the cloud. For years, LMS vendors having been extolling their cloud solutions, with many even claiming to be pure cloud players. The reality is that most providers have a good chunk of clientele running installed versions of the software on premise. Even as a true “pure cloud” solution such as Salesforce finds wide acceptance and adoption in thousands of companies, learning technology has been slow to make the move.
Still, the move is being made. The percentage of companies whose solution is installed has dropped from 48 percent to about 33 percent since 2012. In fact, wanting to move to the cloud is now the No. 3 reason companies decide to replace their LMS solution. This reason previously didn’t even register in the Top 10.
The type of deployment greatly affects many aspects of the LMS. For example, installed solutions are 75 percent more likely to be integrated with performance management systems and 65 percent more likely to be integrated with competency management systems. In general, there is more integration among installed solutions than cloud or SaaS solutions. Additionally, installed clients pay far less per user than hosted clients. But cost savings for cloud users often appear in other areas. For example, installed solutions require far more IT involvement than hosted solutions.
2. LMS Satisfaction Remains Lukewarm at Best
When given the opportunity to rate their satisfaction with their LMS solutions across an array of factors, not one item averages higher than 3.5 on a 5-point scale. The reliability and stability of the system got the highest marks, as it has in previous years. Clearly providers are not having any trouble with up-time, as their systems consistently work. However, some of the more nuanced aspects of life with an LMS leave a bit to be desired. In fact, 31 percent of companies said they would not at all recommend their solution to colleagues.
Selected LMS Satisfaction Ratings (5-point scale)
System Reliability: 3.5
Meets Current Needs: 3.18
Ease of Use by Learner: 3.13
Ease of Navigation: 3.11
Modern Look & Feel: 2.77
Reporting & Analytics: 2.72
Meets Future Needs: 2.57
Source: 2015 Brandon Hall LMS Trends Survey
Perhaps the most striking piece of information contained in these results is that companies feel reasonably certain that their system meets their current needs, placing that in the No. 2 spot for satisfaction. However, coming in dead last is the ability to meet future needs, scoring a dismal 2.57 out of 5. This indicates that companies are not looking far enough ahead when making their technology selection, instead focusing exclusively on solving today’s challenges. And there is virtually no difference in this score for companies whose system has been in place for less than two years and those that have had their platform longer. This means that even organizations that just recently implemented a solution are not that confident it will meet their needs down the road.
These scores also show virtually no change when looking at companies that spend $10 or less per leaner or companies spending $15 or more. If anything, the satisfaction scores for those paying more per user are slightly lower than those on the less expensive end of the spectrum. Clearly, companies do not think they are getting what they are paying for, although those paying more per user may have higher expectations, hence the lower satisfaction ratings.
3. Fewer Companies Look to Replace Their LMS
In light of these poor satisfaction ratings, it is not surprising that 38 percent of companies currently using an LMS are actively looking to switch providers. The surprising finding is that this number is down from previous years, despite satisfaction scores not improving.
The No. 1 reason companies are looking to switch providers is poor vendor support. This is a big change from previous years, as poor reporting has been the No. 1 reason since 2012. Now reporting barely cracks the top 10. No. 2 is a lack of social/collaborative features and No. 3 is a desire to move to a cloud/SaaS solution. This means that 2015’s Top 3 reasons for pursuing a switch are completely different from previous years, when they consistently have been poor reporting, systems that are hard to use, and systems that appear outdated.
4. Reporting and Ease of Use are the Best and Worst of LMS Solutions
Even companies that are not looking to switch providers have things they aren’t completely happy with, as seen in the satisfaction ratings. To get an idea of what is and isn’t working, we asked companies to identify the items they liked most and least about their LMS. The stability and reliability is by far the most appreciated aspect of the LMS, as it has been for years.
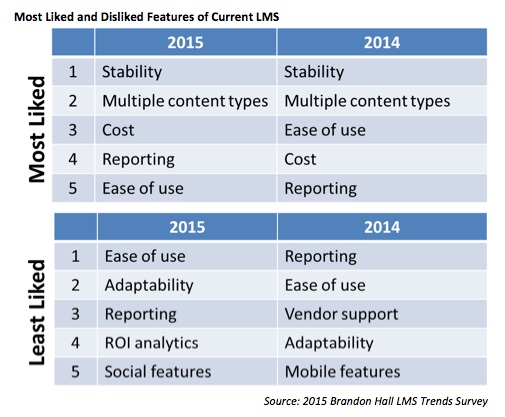
What’s most interesting is that reporting and ease of use appear in both lists. This is a great indication of just how important these things are to companies. When it’s right, it’s great. When it’s not, it’s awful. When a system is easy to use, it often can alleviate many of the other challenges facing the system. A system that is difficult to navigate causes frustration and can even affect the completion and effectiveness of the learning it’s supposed to be delivering.
As for reporting, it’s possible those companies that know what information they want and how to use it are much happier with their systems. In many cases, client companies don’t really know what data they should be collecting or how to analyze it, resulting in a poor reporting experience. Advances by vendors in providing more sophisticated reporting, as well as analytic tools, in combination with more analytic-savvy clients, have seen reporting move up on the liked list and down on the disliked list.
5. LMS Budgets More Likely to Increase Than Remain Steady
It is difficult to pin down the specific amount of spending that goes into an LMS. Large companies are likely to have more L&D headcount and other costs associated with learning, so the budget for the LMS may be a relatively small portion of the overall L&D budget. Also, small companies typically pay more per user, so this can inflate the percentage of the budget the LMS consumes. Because of these and many other factors, budget percentages vary widely.
In general, LMS budgets make up less than 10 percent of the L&D budget, although almost 15 percent of companies dedicate more than 25 percent of the L&D budget to their platform. Regardless of how the LMS fits into overall learning budgets, there is little chance of LMS budgets decreasing next year. Only approximately 7 percent of companies indicated there would be a reduction in the LMS budget. However, 49 percent indicated they expect the budget to increase. The rest (44 percent) said there would be no change.
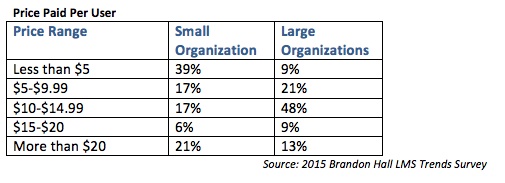
The price companies pay per user for their LMS also varies widely. While the sheer number of users is typically the biggest factor in determining this amount, the range of figures ranges just as widely for large companies as it does for small companies.
David Wentworth is senior learning analyst for Brandon Hall Group, a human capital management (HCM) research and advisory services firm that provides insights around key performance areas, including Learning and Development, Talent Management, Leadership Development, Talent Acquisition, and Workforce Management.


