The spotlight has been fixed on emerging technologies as the future of leadership development. But the 10th annual Leadership Development Survey from Training magazine and Wilson Learning delivers a powerful reminder: Technology alone doesn’t create leaders. The most effective leadership development happens when high-tech tools are fused with high-touch human connection—where data, digital platforms, and artificial intelligence (AI) meet coaching, executive involvement, and real human experience. The leaders of the future will be those who can harness technology to improve efficiency and effectiveness and who can inspire, communicate, and foster trust and genuine connections.
During the past 10 years that Training magazine and Wilson Learning have partnered on this research effort, more than 9,000 Learning and Development (L&D) practitioners and leaders have shared their experiences. This year, more than 1,100 respondents shared their leadership development challenges and leading-edge practices with us—and with you. (See survey methodology at the end of this article)
The survey found that the most effective leadership development organizations used generative AI in planning, assessing leaders, designing programs, creating learning assets, and assessing outcomes. Critically, they did so while also engaging executives, supporting managers in coaching, bringing real-life experiences into learning, and developing leadership character.
The leadership survey is designed to help you set your leaders up for success with a research-driven approach, enabling you to compare your methods to those of leading organizations. This article will report on trends we have seen over the past 10 years, as well as focus on what high-performing organizations do to develop today’s leaders.
Across the 10-year dataset, core leadership development patterns show substantial stability. With the exception of temporary disruptions during the COVID-19 period, there has been little overall movement in investment in leadership development, priority skills, and use of learning methodologies.
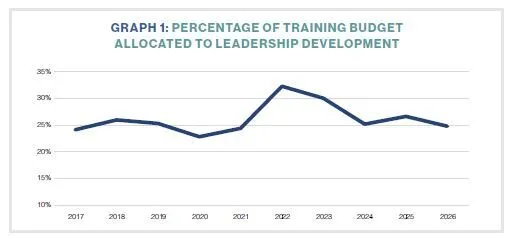
1. Leadership Development Investment Trends: Total training and development spend per employee increased slightly (4.2 percent) from last year to about $165 per person. However, as indicated in Graph 1, the amount allocated to leadership development fell about 1.9 percent. Leadership’s share of the training budget peaked during the COVID-19 years (32 percent in 2022 and 30 percent in 2023); before and after that period, the percentage allocated to leadership development stayed close to 25 percent.
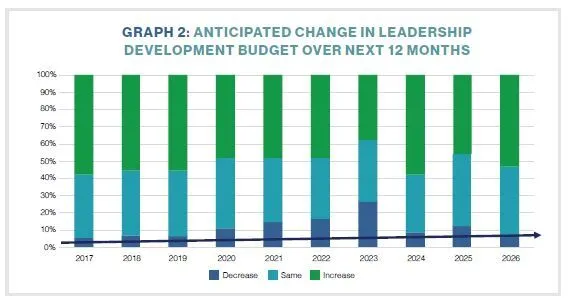
What has shifted is our investment expectations. We have seen more organizations anticipating a decrease in investment in leadership development. As seen in Graph 2, the change is modest but noticeable. Only 5 percent anticipated a decrease in spending in our initial survey in 2017; the average now is closer to 9 percent.
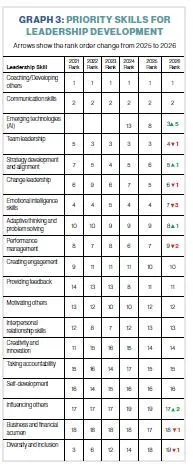
2. Priority Skills Trends: We asked organizations to identify their top five priority leadership skills (Graph 3). Four of the top five skills indicated have remained at the top every year, with the first two (coaching and communication skills) consistently being the two highest priority skills. That said, there have been some notable swings within the broader list. This year, emerging technologies went from 13th to third, a reflection of generative AI’s prominence. Diversity and inclusion rose from 12th in 2020 to third in 2021, then fell to its lowest point at 19th this year.
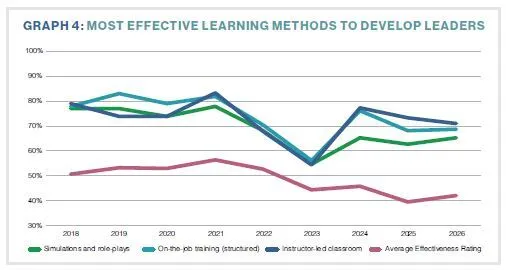
3. Learning Methods Trends: The effectiveness of the learning methods used to develop leaders has also been markedly stable. Graph 4 shows the three most highly rated methods, along with the overall average. Aside from a pronounced dip during COVID, the top methods typically have stayed in the 70 to 80 percent effectiveness range.
Generative AI increasingly is positioned as the answer to effective leadership development, and nearly 40 percent of respondents believe AI has had a high degree of impact on their effectiveness. However, the broader results indicate a more complicated situation.
As in past years, we included a measure of leadership development effectiveness to differentiate highly effective leadership development from lower-performing leadership development efforts. Through our research, we identified six outcomes that define leadership effectiveness. These indicators are elements of leadership development impact that experts agree provide a reliable indication of leadership development performance.
Leadership is a source of competitive advantage: Do senior executives acknowledge the importance of leadership development to the organization’s success?
Best-in-class leaders: Are other companies trying to recruit their leaders?
Attracting high potentials: Does the organization’s approach to leadership attract high-potential leaders from other organizations?
No leadership gaps: Does the organization avoid significant gaps in leadership capacity?
Sufficient resources: Does the organization have the needed resources to effectively develop its leaders?
Sufficient leadership bench strength: How satisfied is the company with its ability to replace departing leaders?
By combining these six measures and then ranking organizations from high performing to lower performing, we create a measure of overall leadership effectiveness.
Our research found that the most effective leadership development efforts report integrating high-tech and high-touch approaches throughout the leadership development lifecycle—planning, assessment, design, development, and evaluation. In these organizations, generative AI and digital tools are used to improve speed, scalability, and personalization, while high-touch practices (e.g., executive engagement, manager coaching, peer learning, and applied experiences) provide the social and organizational conditions needed for behavior change and sustained performance.
GENERATIVE AI IN LEADERSHIP DEVELOPMENT
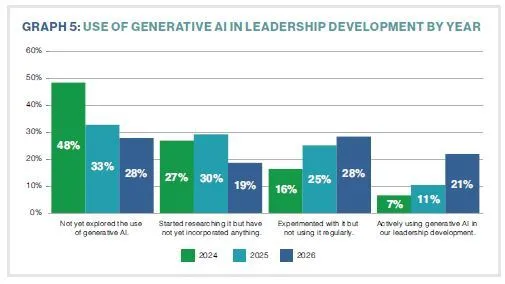
Use of generative AI in leadership development is changing rapidly. As shown in Graph 5, the share of organizations experimenting with or actively using AI has more than doubled, from 23 percent in 2024 to 49 percent this year. Only 28 percent have not explored generative AI, down significantly from 48 percent in 2024.
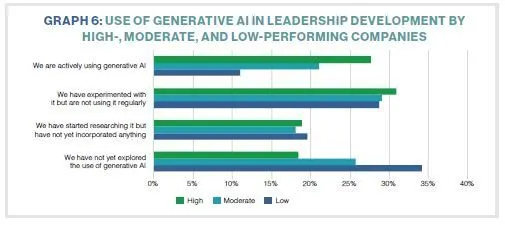
Generative AI adoption also varies by performance group (Graph 6). High-performing organizations report higher rates of active use or experimentation (58 percent) than low-performing organizations (40 percent). This pattern indicates an association between AI adoption and higher reported effectiveness, although the survey design does not establish causality.
What are high-performing organizations doing differently to leverage AI? There are four primary ways high performers are using AI compared to lower-performing organizations (Graph 7).
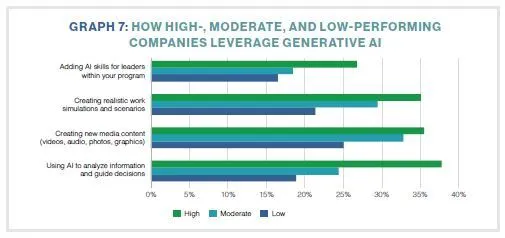
The largest gaps are observed in:
- Teaching AI skills to leaders
- Developing simulations
- Creating new media content
- Using AI to analyze information and support decision-making
In an open-ended question, respondents in high-performing organizations described implementation practices they view as important for responsible and effective use of generative AI:
- Use AI to augment humans, not replace them: Organizations repeatedly emphasized that “humans are always in the loop” when using AI.
- Invest in AI literacy: High-performing organizations point out the need to train L&D leaders and staff.
- Start small and build on successes: Begin with contained tasks, such as creating outlines and drafting smaller content documents, then grow to more robust components such as video and simulations.
- Create a strong governance policy: Before scaling the use of generative AI, many highperforming organizations recommend creating policies and ethical guardrails first. This includes elements such as how to treat sensitive data, approved tools, security, and privacy.
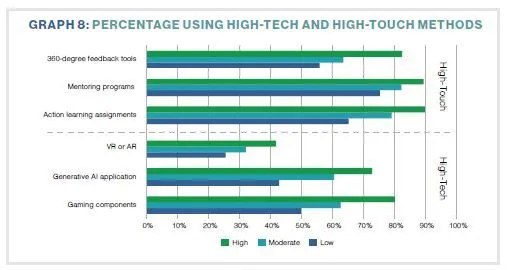
Differences in learning methods further distinguish between high- and low-performing organizations. As shown in Graph 8, high-performing organizations report broader and more frequent use of both high-touch methods (e.g., 360-degree feedback, mentoring, action learning assignments) and high-tech methods (e.g., generative AI applications, game-based components). Reported adoption rates for many methods fall in the 80 to 90 percent range among high performers, compared with rates typically below 60 percent among low performers.
CHARACTER DEVELOPMENT
Character development is a vital element within the high-touch framework. As illustrated in Graph 9, high-performing organizations are significantly more likely to offer dedicated character development programs or embedded character development in their leadership skills programs.
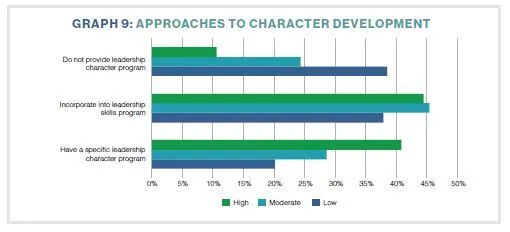
In contrast, low-performing organizations are more likely to not provide character development in any form.
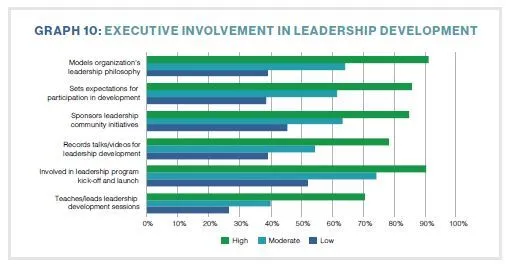
EXECUTIVE INVOLVEMENT
Executive involvement in leadership development is significantly greater in high-performing organizations (Graph 10). On average, more than 80 percent of high-performing organizations engage executives in multiple leadership development activities, compared to only 40 percent of low-performing organizations. High-performing organizations are more likely to have executives actively model leadership behaviors, set clear expectations for leadership development, sponsor leadership community efforts, lead sessions, and record videos for leadership programs.
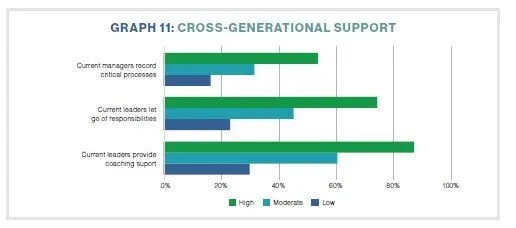
MANAGER COACHING
High-touch involvement of a new leader’s direct manager is critical to leadership development success. Graph 11 shows that current leaders of high-performing organizations are more likely to delegate responsibilities, document critical processes, and provide coaching and support. On average, managers in high-performing organizations are 77 percent more likely to support their new leaders than in low-performing organizations.
LEADING PRACTICES
An effective plan to improve leadership development requires focused action. To complement the quantitative findings, 386 respondents provided qualitative input on practices they believe have strengthened leadership development in their organizations. The themes below are consistent with the high-tech/ high-touch patterns observed in the survey results and offer actionable implications for L&D functions:
• Personalize learning to the leaders: Learning tailored to individual strengths and needs is more impactful, shortens time to effectiveness, and is more relevant and engaging. Generative AI is making the tailoring of learning to smaller groups or even individuals much more cost effective.
LEADING PRACTICE: “You need different programs for different levels of leadership. Focus on individualized learning paths and applicationlevel learning. Know your audience!”
• Involve executives: Leadership development is strongest when senior leaders visibly support, participate in, and model the behaviors expected of others. While most senior executives see leadership development as a priority, the executive team needs guidance on how best to be involved by giving them specific actions that will have the greatest impact.
LEADING PRACTICE: “You need C-suite buy-in, and it cannot be superficial. They need to be engaged with the process from start to end.”
• Align with business strategy and real organizational needs: Leadership development is most effective when tied directly to strategic priorities, business challenges, and outcomes. The days of competency model-based training are giving way to training focused on building capabilities for the modern organization.
LEADING PRACTICE: “Design leadership development as a business strategy—not a training program. Always connect it to a business result, an identified need, or a strategic direction.”
• Use coaching, mentoring, and sponsorship: Relationship-based development was one of the strongest recurring themes among the participants. Both the survey results and the respondents’ leading practices show the critical value of mentors and coaches.
LEADING PRACTICE: “A manager-coaching approach allows for a common leadership language through the organization. Put all leaders through the same coaching program to ensure consistency and shared understanding.”
• Make development practical, applied, and rooted in work: Leadership development is much more than leadership training. Respondents emphasized a move away from theory-based training toward hands-on experiences. Coaching, mentoring, peer networks, action learning, and challenge assignments all need to be part of the overall plan. High-performing organizations build multiple collaborative learning experiences into their leadership development.
LEADING PRACTICE: “Stop treating leadership training like a classroom event. Leadership development is most effective when it’s built around leaders’ actual business challenges. Tie it to real daily operations, match each program to a stretch assignment or mentoring module.”
• Build in measurement and accountability: Measurement and accountability were repeatedly cited as a missing—but essential—element for credibility and impact. While forgoing impact measurement is tempting due to its cost and difficulty, it is increasingly important.
LEADING PRACTICE: “Build measures into the development plans. Measurement should be the first and last thing you consider, before starting and after the program is completed.”
THERE IS AN ANSWER
Through the past 10 years, our research has revealed only a modest improvement in overall leadership development effectiveness. When we started in 2017, the average effectiveness rating was 49 percent. Today, it is 54 percent, only 5 percent higher.
Improving leadership development is no simple task. AI technology alone will not improve it, just as increased eLearning and virtual learning did not either. There is no simple answer, but there is an answer.
Our findings support an integrated approach to leadership development that combines technologyenabled scale with high-touch supports for transfer and behavior change. AI and digital platforms can strengthen design efficiency, personalization, and measurement. However, the highest reported effectiveness is observed where these capabilities are coupled with executive commitment, manager coaching, applied learning experiences, and explicit attention to leadership character.
SURVEY METHODOLOGY
Some 1,115 Learning and Development (L&D) professionals responded to the 2026 Leadership Development Survey. Throughout the 10 years of conducting this annual survey, we have collected data from more than 9,000 respondents. All were employees of companies that create and use leadership development services with their own employees; we exclude external providers of learning and development services from the results.
The majority of respondents (57 percent) had management responsibility, with the largest groups holding the titles of Manager (24 percent), Director (21 percent), and VP or higher (12 percent).
More than half of respondents (62 percent) operated only in the United States; the remaining were composed of multinational (17 percent) and global (21 percent) companies. Organizations were evenly distributed across company sizes, ranging from less than 100 employees to greater than 50,000, with the largest group (21 percent) having 1,000 to 5,000 employees.