NOTE: The graphs cited in this article can be downloaded at the bottom of this page, or you can see them at: https://pubs.royle.com/publication/?i=583717#{“issue_id”:583717,”page”:34}
Good intentions but mediocre results. That seems to be a common conclusion organizations arrive at after evaluating their leadership development programs these days. Indeed, last year, organizations paid more attention to leadership development than any other human capital management function, but less than 41 percent of executives believe their leadership development function is effective, according to Brandon Hall Group research. And poor leadership skills were cited as the second most common reason for executive derailment, Gallup research found.
As organizations continue to focus on leadership development, a key question is: What are high-performing organizations doing differently than lower-performing organizations? This year’s 2019 Annual Leadership Development Survey sought to answer that question while providing a roadmap for organizations wanting to gain a greater return from their leadership development investments.
SHIFTING FOCUS
For the third year, Training magazine and Wilson Learning Worldwide teamed up to conduct a survey focused on what organizations are doing to create effective leaders and prepare the next generation.
The results of this survey indicate high-performing organizations do a number of things differently in terms of where they focus their efforts, the involvement of senior executives, cross-generational mentoring, and preparation of the next generation of leaders. This report will cover those specific actions high-performing organizations are taking to improve the effectiveness of their leadership development efforts and strengthen their organization’s future.
Based on the survey results from 2017 to 2019, there are some interesting shifts:
>>LEARNING METHODS USED FOR LEADERSHIP DEVELOPMENT
Most of the 24 learning methods used for leadership development did not change meaningfully from 2017 to 2019, with four interesting exceptions. Shown in Graph 1, we saw a decrease in the use of job rotation assignments and 360-degree feedback tools. Job rotations were used by 58 percent of organizations in 2017, but that number dropped to 52 percent this year. The usage of 360-degree feedback tools showed a more modest drop, from 69 percent in 2017 and 2018 to 65 percent in 2019.
What replaced these methods? Results indicate that methods with the greatest increase in usage are microlearning and self-paced e-learning. Self-paced e-learning, already used by approximately 80 percent of organizations in 2017-2018, increased to more than 88 percent in 2019. Microlearning, while much lower in overall learning, increased from 55 percent in 2017 to 62 percent in 2019.
While not dramatic changes, they suggest a move toward more self-directed, electronically delivered leadership development programs. However, this also means a shift toward less effective measures. Graph 2 shows the percentage of organizations rating all of the learning methods on effectiveness. Microlearning and e-learning are rated as less effective than job rotation and 360-degree feedback tools, and, in fact, are in the bottom third in effectiveness.
>>CHANGES IN PRIORITY SKILLS
The skill focus of organizations also shows some changes. Organizations were asked to identify the top five priority skills that were the focus of leadership development efforts. Graph 3 shows the rank order of priority skills for each of the three years. While most of the skill priorities remain roughly the same, there are some notable exceptions.
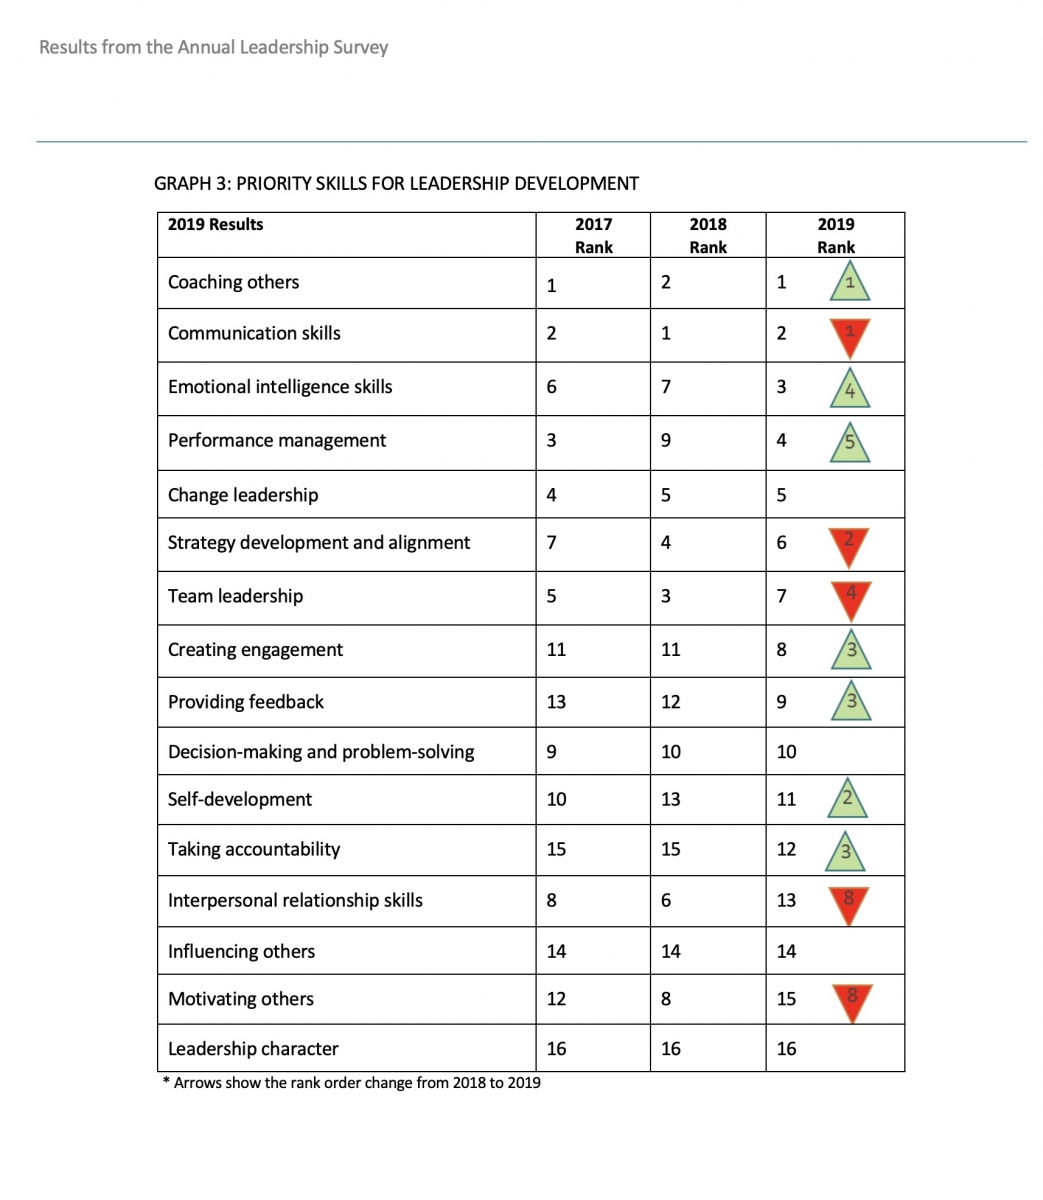
Coaching and communication skills have consistently been the top two skill priorities every year for the last three years. Two other skills increased dramatically in ranking: emotional intelligence went from the sixth and seventh ranking in 2017- 2018 to the third most important skill this year. Performance management, after falling from third to ninth last year, came back up in priority to No. 4 this year. In contrast, motivating others and interpersonal relationship skills both dropped seven spots in the ranking.
>>INVESTMENT IN LEADERSHIP DEVELOPMENT
There has been only a slight change in how organizations invest in leadership development. Graph 4 shows there was an increase over previous years in the percentage of organizations investing 20 to 30 percent of their budget in leadership development and in the percentage investing 40 to 60 percent. However, there was a decrease in the percentage of organizations investing between 60 and 100 percent in leadership development.
WHAT IS EFFECTIVE LEADERSHIP DEVELOPMENT?
Benchmarks are useful guides for making improvements. As such, it is useful to examine what organizations that are more effective at developing leaders do differently than other organizations. We examine this by identifying outcomes that define leadership effectiveness, and then rank organizations from highly effective to less effective.
To do this, we need a measure of leadership development impact. Everyone has a somewhat different perspective on what constitutes success; therefore, we reviewed the literature and identified five outcomes most experts agree provide a good indication of leadership development performance.
1. Leadership is a source of competitive advantage: Do senior executives acknowledge the importance of leadership development to the organization’s success?
2. Best-in-class leaders: Are other companies trying to recruit the organization’s leaders away?
3. Attracting high potentials: Does the organization’s approach to leadership attract high-potential leaders from other companies?
4. No leadership gaps: Does the organization have significant gaps in leadership capacity?
5. Sufficient resources: Does the organization have the necessary resources to effectively develop its leaders?
6. Sufficient leadership bench strength: How satisfied is the company with its ability to replace departing leaders?
Graph 5 shows the percentage of companies indicating effective performance on these outcome measures (attracting high potentials was added in 2018). The vast majority of respondents in all years agree that top management acknowledges leadership is a source of advantage, and a slight majority agree they have best-in-class leaders (55 percent). However, for the other outcome indicators, the majority are not so optimistic.
To determine the actions that more effective organizations are taking to successfully develop the next generation of leaders, we combined (averaged) these six measures into an overall score of leadership development performance. We then divided the averages into three groups based upon the scores.
- High Performer: Organizations that received the highest scores across these six items, indicating they are achieving the highest level of leadership development outcomes
- Moderate Performer: Organizations that received scores in the middle range, indicating they are partly achieving their desired leadership development outcomes but have not achieved full success
- Low Performer: Organizations that received the lowest scores, indicating their leadership development efforts have not achieved much success
By categorizing organizations in this way, we can ask the key question: What are high-performing leadership development organizations doing that low- or moderate-performing organizations are not? In other words, what are some of the actions you can take to improve your leadership development outcomes?
PRIORITY LEADERSHIP SKILLS
Graph 6 shows the percentage of organizations that identified each leadership skill as a priority. This graph only compares the high-performing and low-performing organizations to make it easier to view. The graph shows some interesting differences between high- and low-performing organizations.
First, lower-performing organizations place more emphasis on more basic skills (coaching, communication, performance management). Higher-performing organizations are more diverse and focus more resources on “strategic skills” (strategy development, accountability, decision-making, influencing).
HOW LEADERSHIP DEVELOPMENT NEEDS ARE IDENTIFIED
High- and low-performing organizations also differ in the methods used to identify development needs, as shown in Graph 7. High- and moderate-performing organizations are more likely to let leaders determine their own skill needs, or to follow a formal needs analysis process; lower-performing organizations are more likely to let the executive team select leadership development needs. Higher-performing organizations seem to take more of a “bottom-up” approach to identifying leadership development needs, while lower-performing organizations take more of a “top-down” approach.
LEARNING APPROACH TO DEVELOPING LEADERS
High-performing organizations are significantly more likely to use a wider variety of learning methods than lower-performing organizations. While overall, high-performing organizations are more likely to use all learning methods, Graph 8 shows there is a statistically significant difference in the use of nine specific learning methods.
Interestingly, many of these methods do not require large investments in technology or time. Implementing stretch assignments, action learning projects, job rotations, and mentoring can be done without significant investment in learning platforms and requires fewer resources than many of the others.
Also of interest is the rapid investment in virtual reality (VR), augmented reality (AR), and artificial intelligence among high-performing organizations. While a majority of all organizations are not using these emerging technologies, 35 percent of high-performing organizations have made some use of AR, VR, and AI in their leadership development efforts.
MINDFULNESS IN LEADERSHIP DEVELOPMENT
Much has been written over the last year about the impact and value of mindfulness training. So, new to the survey this year, we asked a few questions about the use of mindfulness techniques within leadership development initiatives. More than 50 percent of high-performing organizations see mindfulness as an important part of their culture and encourage leaders to practice mindfulness; 47 percent incorporate mindfulness activities into their leadership development programs. This is true in less than 30 percent of low-performing organizations.
EXECUTIVE INVOLVEMENT IN LEADERSHIP DEVELOPMENT
A clear difference between high- and lower-performing organizations is the degree to which executives are involved in leadership development. Graph 9 shows that high-performing organizations are much more likely to have executives directly involved in all aspects of leadership development, from kicking off or leading sessions to modeling the organization’s leadership philosophy.
EFFECTIVENESS OF LEADERSHIP DEVELOPMENT INITIATIVES AT DIFFERENT LEVELS
Moderate-performing organizations are more confident in their leadership development at the supervisory and middle-management levels, while high-performing organizations are more confident in their efforts for executives and their high-potential groups (all above 50 percent). Both see their leadership development as more effective than low-performing organizations do.
SUPPORT FOR TRANSITIONING NEW LEADERS
One of the greatest areas of difference between high-, low-, and moderate-performing organizations is the degree to which organizations support new leaders in the transition to a leadership position. Graph 10 shows the percentage of organizations that strongly agree with each of the statements. High-performing organizations are much more likely to help new managers through the transition by providing coaching and mentoring during the transition, helping them adopt more advanced leadership skills, manage time and priorities, develop new relationships, and manage their own personal expectations.
MAKING THE NEXT GENERATION OF LEADERS A PRIORITY
A critical difference between high- and lower-performing organizations is the degree to which they make preparing the next generation of leaders a priority. Graph 11 shows the percentage that agree or strongly agree on actions to support the next generation of leaders. High-performing organizations are much more likely to match their development approach to younger leaders’ expectations, have a clear focus on developing the next generation, and effectively recruit and attract new leaders to their organization.
LEVERAGING CROSS-GENERATIONAL SUPPORT FOR LEADERSHIP DEVELOPMENT
High-performing organizations also are much more likely to take advantage of the current generation of leaders to help prepare the next generation. Graph 12 shows the percentage of organizations that agree and strongly agree with each statement about cross-generational support. High-performing organizations have stronger bench strength, seek to leverage the talents of current leaders to develop new leaders, have a succession plan in place, and take steps to capture the knowledge of current leaders..
ACTIONS TO SUPPORT DEVELOPMENT OF NEW LEADERS
We asked organizations to indicate their use of specific actions to support development. Graph 13 shows the percentage of organizations that indicated usage of each technique. While few organizations overall are asking current managers to document (via audio/video recordings) critical processes, high-performing organizations were more likely than lower-performing organizations to use structured job shadowing, knowledge-sharing platforms, and stretch assignments. There are smaller differences in the use of job rotations and on-the-job coaching.
TAKEAWAYS: HOW TO STRENGTHEN LEADERSHIP DEVELOPMENT
The results of this survey suggest several actions organizations can take to strengthen their leadership development efforts by modeling the practices of higher-performing organizations. Specifically, the results indicate you can achieve a greater impact by:
- Engaging executives. Senior executives need to see leadership development as a priority. Encourage the executive team to communicate specific expectations, model desired leadership behavior, create leadership succession plans, and engage directly in leadership development activities.
- Identifying leadership skill needs from the bottom up. Lower- and moderate-performing organizations are more likely to let senior executives determine leaders’ development priorities. Higher-performing organizations let leaders themselves, or a formal needs assessment process, drive training priorities.
- Supporting the transition to the next generation of leaders. As Baby Boomer leaders continue to retire, there is an increasing need to transition to the next generation. High-performing organizations are more likely to tailor learning methods to the new generation of leaders, help new leaders manage the transition to leadership positions, and make next-generation leaders a priority for the organization.
- Leveraging the current generation of leaders. Higher-performing organizations prepare the current generation of leaders for the role of coach and mentor and, as a result, have more effective leadership development efforts. Organizations need to encourage Baby Boomers to embrace the role of coach and help prepare them to effectively fulfill that role.
- Focusing on structured on-the-job learning. In the last several years, there has been a focus on easier and cheaper learning methods (i.e., microlearning, self-directed e-learning). However, what differentiates high-performing from lower-performing organizations is the use of more complex, but more effective, methods. Focusing more effort on structuring stretch assignments, action learning, job rotations, and mentoring—although difficult to implement— will better prepare new leaders.
- Incorporating mindfulness into leadership. An unexpected result is the significant difference between high- and low-performing organizations in their use of mindfulness training techniques with leaders. While still used by a minority of low- and moderate-performing organizations, high-performing organizations are beginning to embrace this technique to encourage and develop mindfulness practices in leaders.
These best practices of leadership development can help you make a greater strategic contribution to your organization’s leadership. As the next generation of leaders begins leading teams, departments, business units, and organizations, it is your responsibility to make sure they are well prepared for these roles. The very future of your organization may depend on it.
Michael Leimbach, Ph.D., is a globally recognized expert in instructional design and leadership development. As vice president of Global Research and Development for Wilson Learning Worldwide, he has worked with numerous Global 1000 organizations in Australia, England, Germany, Japan, South Korea, Taiwan, and the United States. Over more than 30 years, Dr. Leimbach has developed Wilson Learning’s diagnostic, learning, and performance improvement capabilities. He serves on the ISO Technical Committee (TC232) on Quality Standards for Learning Service Providers and the University of Minnesota College of Education and Human Development Dean’s Advisory Board. Dr. Leimbach has coauthored four books, published more than 100 professional articles, and is a frequent speaker at national and global conferences. For more information, contact Wilson Learning at 800.328.7937 or visit WilsonLearning.com.
SURVEY METHODOLOGY
More than 720 Learning and Development (L&D) professionals responded to the 2019 survey. Overall, in the last three years, we have collected data from more than 1,700 professionals. All were employees of companies that create and use leadership development services with their own employees; external providers of learning and development services were excluded from the results.
The 2019 survey responses consisted of a well-balanced representation of professionals and decision-makers within the Learning and Development industry. The majority of respondents (57 percent) had management responsibility, with the largest groups having the title of manager (23 percent) or director (22 percent).
A little more than half of the respondents (57 percent) operated only in the United States; the remaining were composed of global (25 percent) and multinational (18 percent) companies. Organizations were fairly evenly distributed in company size, ranging from less than 100 employees to more than 50,000, with the largest group (22 percent) having 1,000 to 5,000 employees. Individual organizations spent an average of $1.85 million on training annually, slightly lower than the $1.9 million spent in 2018, but higher than the $1.3 million spent in 2017. Training and development spending per employee has shown a steady increase over the last three years. Companies on average spent $194 per employee on training. This was 7 percent higher than the $181 per employee in 2018 and 49 percent higher than the $130 per employee in 2017.
Michael Leimbach, Ph.D., is a globally recognized expert in instructional design and leadership development. Asvice president of Global Research and Development for Wilson Learning Worldwide, he has worked with numerous Global 1000 organizations in Australia, England, Germany, Japan, South Korea, Taiwan, and the United States. Over more than 30 years, Dr. Leimbach has developed Wilson Learning’s diagnostic, learning, and performance improvement capabilities. He serves on the ISO Technical Committee (TC232) on Quality Standards for Learning Service Providers and the University of Minnesota College of Education and Human Development Dean’s Advisory Board. Dr. Leimbach has coauthored four books, published more than 100 professional articles, and is a frequent speaker at national and global conferences.
For more information, contact Wilson Learning at 800.328.7937 or visit WilsonLearning.com.