
The wave of information known as Big Data has been growing exponentially in recent years, and organizations are hungrier than ever for more data. They collect data from systems all across the enterprise, certain it holds to key to improving results. While companies have been getting better at collecting more meaningful data, understanding just what it means is another story altogether.
Brandon Hall Group’s 2017 Learning Analytics Study found that few organizations are able to run proper analysis on the learning data they are collecting, and, therefore, are challenged to determine the impact learning is really having on the business. Of course, a big part of the problem is that companies are still heavily focused on more transactional data such as course completions and grades, as found in Brandon Hall Group’s 2016 Learning Measurement Survey. But still, even if they are collecting the kind of metrics that help link learning to organizational and individual performance, very few are able to make much sense of it. In fact, overall, only about 1 in 5 organizations do an above-average job with analytics.
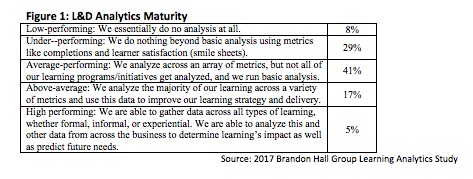
While, in a general sense, companies are not so great with learning analytics, the study also found that high-performing companies (those with improved key performance indicators—KPIs—such as increased revenue, market share, customer satisfaction, etc.) do a far better job. More than 40 percent of these high performers report being better than average with learning analytics, while only 9 percent of lower-performing companies say the same.
Despite the study finding a grim current outlook on learning analytics, the results for high performers is promising. These results, along with the findings of the Learning Measurement Study, show that a focus on gathering performance- and behavior-based learning metrics combined with the skills and tools to understand the data is the required recipe for ensuring learning is having its full potential impact on the business.
Top 5 Learning Analytics Research Findings
- Less than half of organizations have in-house skill to analyze data.
- Most companies analyze data via their learning management system (LMS).
- In general, few learning programs are subject to analysis.
- Learning analysis rarely includes data from other systems.
- Analysis output typically is customized and readily shared with business leaders.
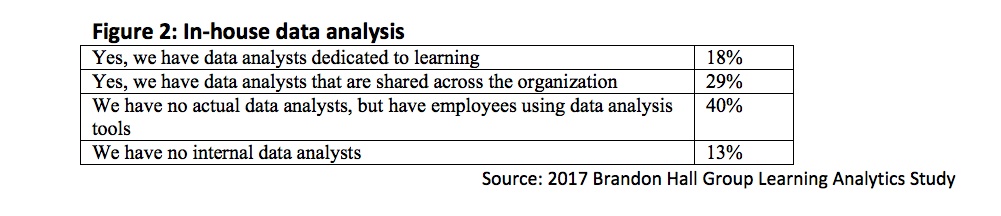
1. Less than half of organizations have in-house skills to analyze data. The biggest reason so few organizations consider their learning analytics efforts above average is because they simply do not possess the skill set internally to do the analysis. Many of the learning technologies that are generating the data do have analytics tools built in, and there are off-the-shelf analysis tools that don’t require extensive analytics skills. However, those can’t fully replicate or replace the ability to understand the data, ask the right questions, and communicate what the data is showing. The survey found that 47 percent of companies have data analysts on staff, whether specific to learning or generally within the organization.
The size of an organization obviously influences its ability to staff data analysts. Among large enterprise companies—those with 10,000 or more employees—56 percent have people in analyst roles. For companies smaller than that, the number is 40 percent.
However, there is a stronger correlation between having actual analysts on staff and high organizational performance. Among high performers (companies with increasing KPIs year over year), 59 percent have analysts in house. For everyone else, that number is 39 percent. And even though most companies do not have full-time analysts on staff, only about one-quarter employ outside help for their analysis.
2. Most companies analyze data via their LMS. We saw in the previous finding that the most common approach to learning analytics is to have employees (who are not data analysts) look at the data via some sort of tool. The tool they most rely on is Microsoft Excel, with 80 percent of companies indicating they use the spreadsheet application for learning analytics. This is reflective of the fact that these are not data analysts doing the work. Companies with analysts typically use tools such as SQL (18 percent), Access, (17 percent), or Tableau (15 percent). In many cases, the data isn’t even leaving the LMS to be analyzed.
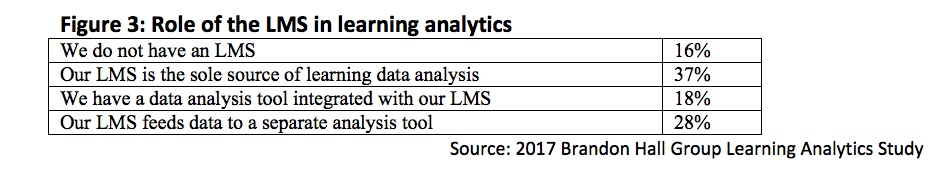
For the 84 percent of companies using an LMS, two-thirds say their learning data analysis occurs within their LMS, either natively or via an integrated tool. The other one- third of organizations exports the data from the LMS into a separate tool (such as the aforementioned Excel, Tableau, etc.).
While LMS solutions are offering more robust reporting and analytics than they have previously, they cannot compare to the horsepower of applications designed specifically for data analysis. But because most of these tools require a working knowledge of statistics and analytics to be effective, companies eschew them for tools that are easier to use. This is not inherently a bad thing, but Brandon Hall Group’s research into LMS trends for the last several years finds that reporting and analytics is one of the least liked and least satisfactory aspects of current LMS solutions, and often one of the main reasons companies want to switch to new providers. Clearly these solutions are not quite getting the job done.
3. In general, not many learning programs are subject to analysis. In Brandon Hall Group’s Learning Measurement Study, we found that few organizations are gathering metrics beyond Kirkpatrick Levels 1 and 2 for a large percentage of their learning programs. Therefore, it is not surprising to see that nearly two-thirds of companies say they run analytics on no more than half of their learning programs. When all the data a company has are completion rates, smile sheets, and test scores, there is not much analysis to be done.
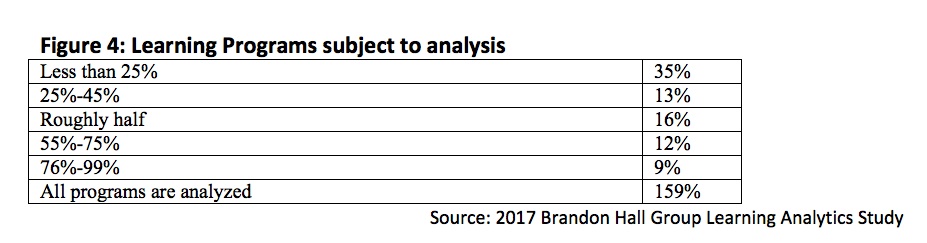
Once again, however, there is a correlation between high performance and learning analytics. Nearly one-quarter (23 percent) of high-performing organizations say that all of their learning programs are analyzed, while only 9 percent of lower performers do that level of analysis.
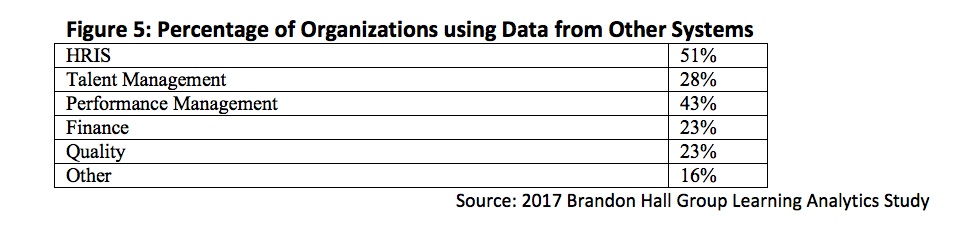
4. Learning analysis rarely includes data from other systems. One of the biggest drivers behind the need for more analysis is that companies have access to more data than ever before. Proper analytics can help an organization take information from every part of the business and understand the impact learning is having. Unfortunately, companies are not necessarily taking advantage of what is available to them. Just over half of companies use data from their human resource information system (HRIS) when running analytics for learning. As for areas that arguably have a larger impact on the business, there is even less data importation.
5. Analysis output is typically customized and readily shared with business leaders. Once all of the analysis is done, it typically needs to be output in some fashion. Rarely is the person running the analysis the person who ultimately needs to see the results and make decisions based on what is found. For more than half of companies, these reports are either the stock outputs of the tool they are using, or somewhat customized versions of them. This means that for companies using their LMS for analysis—which is most of them—they are limited not only by what is going into their analysis, but also what is coming out. High-performing organizations are more likely to create more relevant analysis, as 52 percent of them create fully customized outputs, versus 39 percent of low performers.
Almost as critical as the quality and substance of the reports is who gets to see the data. If the information isn’t shared with the proper stakeholders, it may as well not exist. Learning analytics can be used to make decisions throughout the organization, whether it has to do with performance management, compliance, succession management, etc.
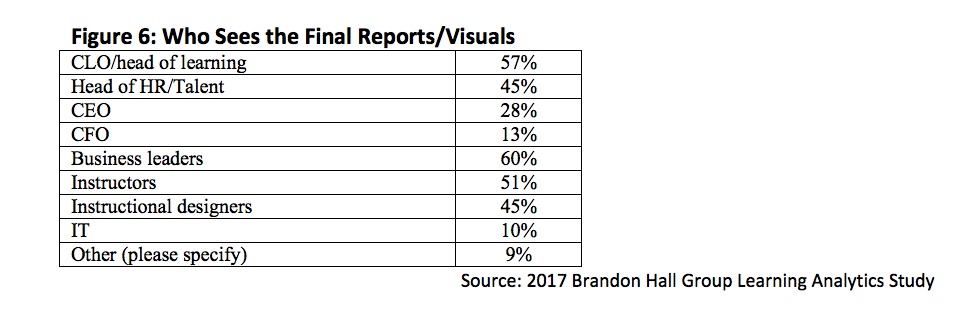
Only 27 percent of CEOs are getting intelligence from learning. Of course, for larger organizations, it can be difficult for the CEO to keep tabs on everything that goes on in the company, but insight into such a large investment in people can be crucial. The bright spot, however, is that 60 percent of companies are sharing their analysis with business leaders. This means that the people most directly affected by learning outcomes are able to see what’s working and what isn’t.
Conclusion
Learning analytics may seem like an extravagance for many organizations with already limited budgets. The idea of having someone dedicated to crunching learning data may not be feasible. However, the fact is that Big Data has no ebb in sight, and information is the currency of today’s successful businesses. Simply collecting data is no longer enough. It is critical for companies to be able to look at data from all over the business and be able to tell a story and answer questions around what is happening. Otherwise, learning is occurring within a vacuum, with no real insight into how it is affecting the rest of the business. Data analysis will be a critical role for organizations, and not just for learning.
David Wentworth is principal learning analyst for Brandon Hall Group, a leading independent human capital management research and analyst firm, with research and consulting practices in Learning & Development, Talent Acquisition, Talent Management, Leadership Development and Workforce Management/HR.


